

Google, Amazon and Datadog have each built an AI model that forecasts any series of numbers, from sales to server traffic. We pointed all three at two years of stock prices. Here is what they saw coming, and what really happened.
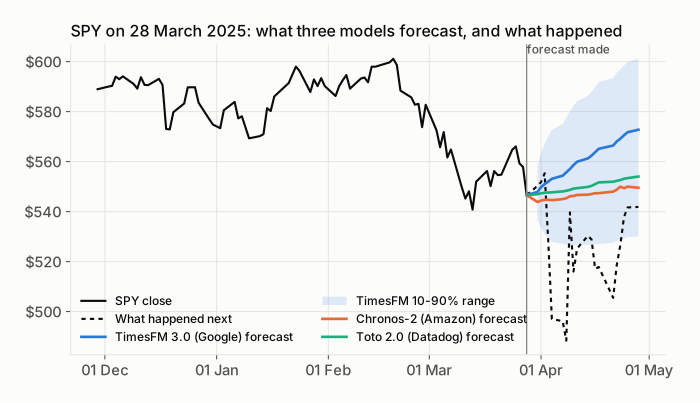
Can AI predict stock prices? Not the new forecasting models we tested. We gave three of the most accurate ones two years of daily prices for 24 large US stocks and ETFs. They did no better on real stocks than on random noise we generated ourselves, and every trading rule built on their forecasts ended below simply holding the stocks.
The three are time series foundation models: the idea behind ChatGPT, applied to numbers over time instead of words. Each is pretrained on billions of data points and forecasts a series it has never seen, with no extra training. Each was built for a different job:
- TimesFM 3.0 from Google Research, released in August 2026. A general-purpose forecaster that Google also runs inside BigQuery and Google Sheets.
- Chronos-2 from Amazon, built for business forecasting such as retail demand and energy use.
- Toto 2.0 from Datadog, trained mostly on infrastructure metrics, the server load and traffic numbers Datadog monitors for its customers.
On that kind of data they are excellent, at or near the top of public forecasting benchmarks. Stock prices turned out to be a different kind of series. Below is every number from our test, with charts you can play with.
Code and data are open. Every script, forecast and result behind this post is in moneyheap/tsfm-stocks on GitHub under the MIT license, so you can rerun the test or swap in another model.
What do the forecasts actually look like?
Nearly flat. The models learned that, for a series like this, “about where it is now” is the safest guess. TimesFM 3.0’s typical forecast for the next day was a move of 0.13%, while the typical real move was 0.97%. Replay any week of the test in the chart at the top and you’ll see the same picture: a fan of gentle lines, and a real price that goes its own way.
The chart opens on 28 March 2025. SPY closed at $546.59 (dividend-adjusted). By 8 April it had fallen 10.7%, after the US tariff announcement of 2 April, and it spent the rest of the month recovering. TimesFM 3.0 forecast SPY 4.8% higher 20 trading days later; Chronos-2 and Toto 2.0 forecast +0.5% and +1.4%. Five days in, SPY was at $497, below the low end of all three models’ ranges (about $527).
The models had no way to know about tariffs, and that is the point: what moves a stock is usually news, and none of it is in the price history.
Why are the lines so smooth when real prices zigzag? Each line is the middle of the model’s forecast for each future day, not one possible path. All three models return a range for every day instead of sample paths, and the middle of many possible paths is smooth because their ups and downs cancel out. The randomness lives in the shaded band, the range the model expects the price to stay inside 8 times out of 10, and the band widens the further ahead the model looks.
Turn on Possible paths in the chart at the top to watch it happen. Each path strings together the stock’s own daily moves from the two years the models saw, picked at random. One path zigzags like a real price; with 100 or 400 of them, the line through their middle (in violet) straightens out and looks much like the models’ lines.
For a series with no pattern, a nearly flat middle line is the forecast with the smallest error, so the models behave sensibly here: they found nothing to forecast.
Can you tell a real stock from a random one?
Try it. One chart in each pair is a real stock over the two years of our test; the other is a random walk we generated to match it, with the same average daily move and the same volatility. Pick the real one, then see how the models did on each.
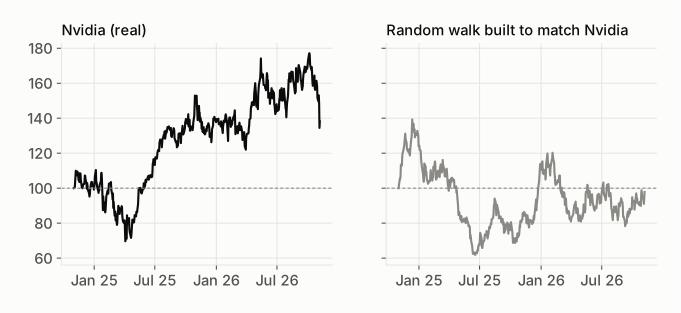
If you picked right, you probably used something the models don’t have: you remember what happened. The sharp drop in April 2025 gives many real stocks away. A model that only sees a column of numbers has nothing like that. On the price history alone, it scores the same on the real stock as on its fake twin.
Can AI predict stock prices?
No, not from price history alone. Across 24 tickers and 504 trading days (1 November 2024 to 6 November 2026), the three models got the next day’s direction right 49.9% to 51.1% of the time. A rule that always says “up” was right 52.2% of the time, because the market rose over the period.
Their forecasts were also less accurate than the plainest forecast possible, “tomorrow’s close equals today’s”. And on random walks, series that can’t be predicted by construction, they scored the same as on real stocks. In our data the models can’t tell a real stock from a coin.
The small moves the models do forecast have no relation to what happened next. Plot every forecast against the real move, and a model with skill would put the dots along the diagonal.
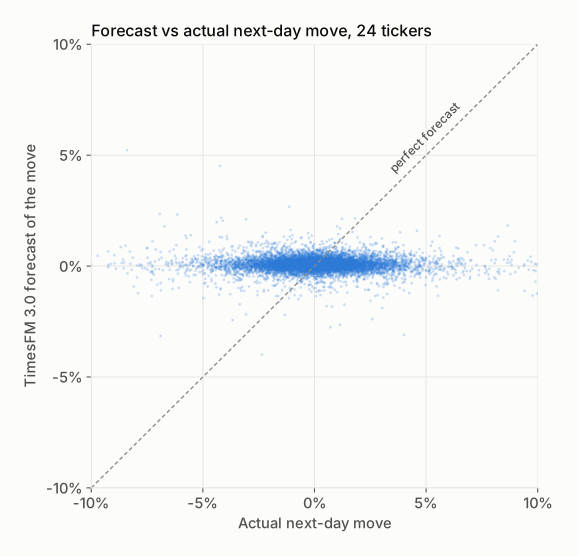
The correlation between forecast moves and real moves was -0.02 for TimesFM 3.0, -0.02 for Chronos-2 and -0.01 for Toto 2.0: zero for practical purposes. Zoom into the forecast axis and the band gets taller, but it doesn’t tilt. At every horizon, all three models were slightly less accurate than “no change”: their average error was up to 4% larger than if they had forecast no move at all.
What are time series foundation models?
A time series foundation model is a neural network pretrained on billions of data points from many kinds of series, such as energy use, traffic, retail sales and weather. You give it a new series it has never seen, and it forecasts the next values straight away, with no training on your data. This is called a zero-shot forecast.
The three we tested, side by side:
| Model | Made by | Released | Built for | Size we used |
|---|---|---|---|---|
| TimesFM 3.0 | Google Research | 31 August 2026 | General forecasting | 330 million parameters |
| Chronos-2 | Amazon | 20 October 2025 | Retail demand, energy | 120 million parameters |
| Toto 2.0 | Datadog | April 2026 | Infrastructure metrics | 313 million parameters |
All three sit at or near the top of GIFT-Eval, the public forecasting benchmark run by Salesforce AI Research. Google describes TimesFM 3.0 as first among foundation models on all three main benchmarks. Each model returns a middle forecast plus a range: a 10% and a 90% quantile, the values it expects the price to stay above and below 9 times out of 10.
How did we test the models?
We fed each model the 512 most recent daily closes of a ticker (about two years), took its forecast for 1, 5 and 20 trading days ahead, then moved one day forward and did it again. That gave about 12,000 forecasts per model on real data, each scored against what happened.
- Tickers: the SPY, QQQ and IWM ETFs, and 21 large US stocks across sectors: Apple, Microsoft, Nvidia, Amazon, Alphabet, Meta, Tesla, Broadcom, AMD, Netflix, JPMorgan, Visa, Exxon Mobil, UnitedHealth, Johnson & Johnson, Procter & Gamble, Coca-Cola, Walmart, Home Depot, Costco and Caterpillar.
- Data: daily closes from Yahoo Finance, adjusted for splits and dividends.
- Test window: 504 trading days, 1 November 2024 to 6 November 2026. A model only ever sees closes up to the day it forecasts from.
- Control: for each ticker, one random walk with the same start price, average daily move and volatility, the twins from the game above. Any edge a model shows on these is luck, so they tell us what luck looks like.
- Baselines: “no change” (tomorrow equals today), “always up”, and for the ranges a simple volatility rule with no AI in it.
We used each model the way its developers’ documentation shows, with default settings. Running all three over the full window took under two minutes on one consumer GPU.
Did the models get the direction right?
Barely more often than a coin flip, and less often than “always up”. On real stocks, next-day direction was right 50.6% of the time for TimesFM 3.0, 49.9% for Chronos-2 and 51.1% for Toto 2.0. On the random walks they scored 50.2%, 50.5% and 49.9%. The gaps are inside the margin of error, about 1.2 percentage points either way.
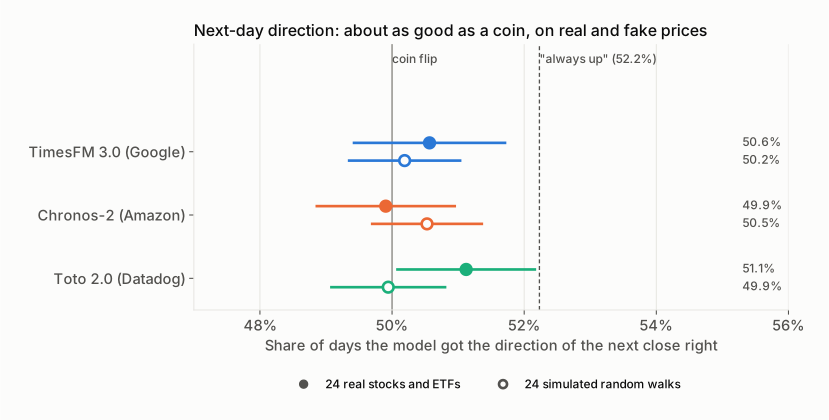
Over 20 days the hit rates look better, 50.9% to 53.2%, but only because the market rose: “always up” got 56.1% over the same horizon.
Single tickers make this easy to misread. Switch the chart to Ticker by ticker: TimesFM 3.0’s hit rate ran from 47.2% on Johnson & Johnson to 56.7% on JPMorgan. With about 500 forecasts per ticker, a spread that wide is what chance alone produces, and the random walks spread just as wide. A test on JPMorgan alone would have made a good headline and a wrong conclusion.
What happened in a simple backtest?
Every version ended below holding the stocks. The test rule: each day, hold a stock only if its model forecast a higher close tomorrow, otherwise hold cash, with a 0.05% cost on every switch. Split $10,000 equally across the 24 tickers this way, and it grew to between $10,893 and $12,181. Holding all 24 every day grew to $15,036.
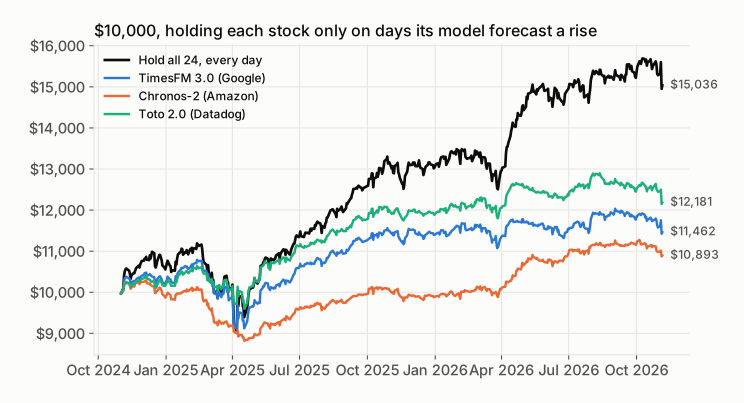
Toto 2.0 deserves a closer look, because it fell less than holding: its worst drop was 9.7% against 19.1%. Before costs, its return per unit of risk (the Sharpe ratio, return divided by how much it swings) was 1.46 against 1.31 for holding. So we checked it against luck: 2,000 rules that flip a coin each day and stay in the market on the same 55% of days. 17% of the coins did as well or better. That is not rare enough to count as skill, and after costs Toto’s Sharpe ratio fell to 1.09, below holding.
Costs matter more than they look. Each rule switched in or out of each stock 118 to 140 times in two years. At 0.05% per switch, that took 7 to 9 percentage points off the total return. Flip the chart to Without costs to see the difference.
Is there anything these models do well?
Yes: the ranges. The real price landed inside the models’ 10%-90% range 72% to 80% of the time, close to the 80% a well-calibrated range should hit. But a plain rule with no AI did as well: a range based on the last 60 days of daily moves covered 79% to 82%.
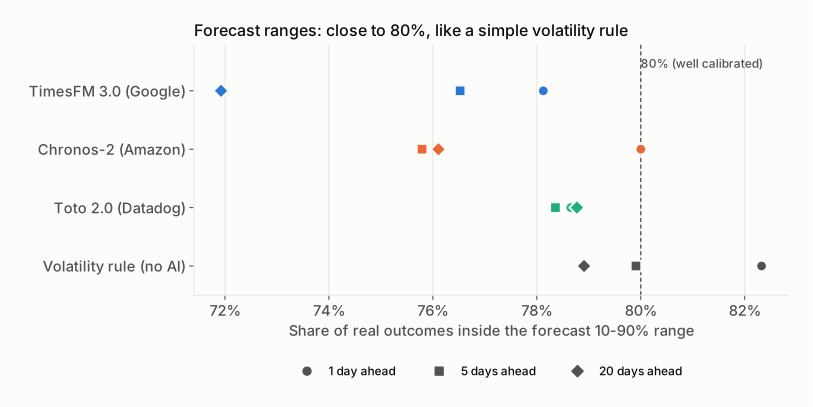
That fits what these models are good at in general. They pick up how much a series tends to move, and for stocks that is the one thing in the price history that does persist: calm periods tend to stay calm, and wild ones stay wild for a while. Which way the next move goes is a different question, and the history doesn’t answer it.
Do they work better on hourly or 5-minute prices?
No. We ran the same test on hourly bars (28 March 2024 to 6 November 2026) and on 5-minute bars (25 August to 6 November 2026, as far back as Yahoo Finance keeps them), with the same 24 tickers, 512 bars of history and random-walk twins. That is about 100,000 forecasts per model at each timeframe.
| Next move’s direction right | Daily | Hourly | 5-minute |
|---|---|---|---|
| TimesFM 3.0 | 50.6% | 49.9% | 50.7% |
| Chronos-2 | 49.9% | 50.0% | 50.2% |
| Toto 2.0 | 51.1% | 49.9% | 50.7% |
| Same models on random walks | 50.2% | 50.1% | 50.0% |
| No AI: bet the last move reverses | 49.7% | 50.7% | 51.3% |
On hourly bars the models were exactly a coin. On 5-minute bars TimesFM 3.0 and Toto 2.0 beat their random-walk scores by 0.7 points, more than the margin of error (about 0.4 points). But the one-line rule in the last row did better without any AI. Over minutes, prices tend to bounce back a little, partly because trades alternate between the buying and the selling price. That bounce is a known quirk of how prices are recorded, not a view of where a stock is going.
It is also too small to trade. The typical 5-minute move was 0.07%, so a 0.7-point edge in direction is worth about 0.002% per bar before costs, a small fraction of the 0.05% cost per switch in our backtest. At every intraday step the models’ errors were again 1% to 12% larger than forecasting no move at all.
Why don’t these models work on stocks?
Because there is very little in a price history to learn from. Series like electricity demand repeat: every weekday morning, every winter. Stock prices react to new information, and once a pattern is widely known, trading tends to remove it. What’s left in the history is mostly noise, and a model trained to find repeating shapes finds none.
Researchers who tested these models on returns came to the same place. A 2025 study of global markets found that off-the-shelf models performed poorly, both zero-shot and fine-tuned; only models pretrained from scratch on financial data improved. A June 2026 paper on five large US stocks found gains over a random walk were “small and sparse”, statistically significant for only two model and stock pairs.
One more reason to trust a negative result here: some of these models may have seen part of our test period during pretraining, since all three were released during or after it. That would flatter them, not hurt them, and they still showed no edge. On the days after each model’s release alone, which it can’t have seen, next-day direction was right 49.1% (TimesFM 3.0, 47 days), 50.3% (Chronos-2, 263 days) and 49.7% (Toto 2.0, 142 days) of the time.
What does moneyheap do instead?
moneyheap doesn’t forecast prices. It reads what moves them, the news, filings, fundamentals and market data around each stock, and reports what changed, why it may matter and how confident the analysis is. Sentiment comes as a score with a confidence level, not as a price target, and how moneyheap analyzes the market walks through one real stock.
A price forecast looks precise, but as the April 2025 replay shows, the precision is mostly an illusion. Our methodology and risk disclosures say what our analysis can and can’t tell you.
Frequently asked questions
Would a bigger model or fine-tuning on stock data help?
Probably not much from prices alone. On the benchmarks the gaps between model sizes are small, and the 2025 study above found that fine-tuning general models on returns didn’t fix them. Models pretrained from scratch on financial data did better in that study, but that is a research result, not a tool you can download today.
Can I run these models myself?
Yes. Chronos-2 and Toto 2.0 are open under the Apache 2.0 license. TimesFM 3.0’s weights are free for non-commercial use only; Google offers commercial use through BigQuery ML. All three run on a single consumer GPU, and Chronos-2 and the smaller Toto 2.0 versions also run on a CPU. Our test code downloads the prices and runs all three, so you can start from it.
Is AI useless for market research, then?
No. These models only look at a column of numbers. Language models such as Claude are useful for reading news, filings and earnings calls, and for summarizing what changed. That is a different job from predicting a price, and AI trading agents covers where it goes wrong when people mix the two up.
Why did you test on random walks?
To see what luck looks like with the same tools. A random walk has no pattern to find, so any score a model gets on it is chance. When the scores on real stocks match the scores on random walks, as they did here, the model found nothing in the real prices either.
Methodology and sources
The test ran on 9 November 2026 on daily closes from Yahoo Finance for 24 tickers, from 2 January 2014 to 6 November 2026, adjusted for splits and dividends. Forecasts were made on each of the 504 trading days from 1 November 2024 onward, using the 512 previous closes, for 1, 5 and 20 days ahead. Models: TimesFM 3.0 (google/timesfm-3.0-pytorch), Chronos-2 (amazon/chronos-2) and Toto 2.0 313m (Datadog/Toto-2.0-313m), all with default settings and no fine-tuning. The direction margins are 95% intervals over daily averages. The trading rule is a simplified test: equal weights rebalanced daily, closing prices, a flat 0.05% cost per switch, and no taxes or slippage. The replay shows every fifth trading day for six tickers; the scatter shows 3,000 forecasts picked at random. The intraday test used Yahoo Finance bars from regular trading hours, full sessions only, with a forecast from every bar: 722 days of hourly bars and 58 days of 5-minute bars. Before the main run we checked the setup on synthetic series with a clear pattern (a seasonal wave with a trend), where all three models cut the error of a no-change forecast by about 94%, so the models were fed correctly. Model release dates and benchmark standings come from the developers’ pages and the GIFT-Eval leaderboard as of November 2026. The code, the forecasts and the results are at github.com/moneyheap/tsfm-stocks.
What this test can’t tell you: how the models do with other inputs (news, volume, other stocks as covariates), on tick data or in other markets, or after fine-tuning. The 5-minute test covers only 58 days. Two years of a mostly rising market is one period; results in another period can differ. Past results don’t show what will happen next.
moneyheap is a market research tool. This post is for information and education only. It is not financial advice or a recommendation to buy or sell any security. Do your own research.
 Artem Kondyukov · 9 min read
 Alex Chertkova · 10 min read